A Comprehensive Market Intelligence Report for Indian Distributors and Regional Wholesalers to Capitalize on Domestic Growth Opportunities
Executive Summary
India’s smartphone screen protector market presents exceptional growth opportunities, valued at $2.48 billion in 2023 and projected to reach $4.40 billion by 2030 at an impressive 8.5% CAGR[158]. This domestic market analysis provides distributors and wholesalers with critical insights into regional demand patterns, state-wise growth projections, and strategic opportunities across India’s diverse geographical and economic landscape.
With over 1 billion smartphone users by 2025[165] and 900+ million internet users[170], India represents one of the world’s most dynamic mobile accessories markets. The implementation of BIS IS 19348:2025 certification requirements creates both compliance challenges and market formalization opportunities for strategic players.
National Market Overview and Growth Drivers
Market Size and Trajectory
India’s mobile screen protector market demonstrates robust fundamentals:
- Current Market Value: $2.48 billion (2023), growing to $2.92 billion (2025)[158]
- Projected Market Size: $4.40 billion by 2030[158]
- Growth Rate: 8.5% CAGR (2024-2030)[158]
- Volume Projection: From 342 million pieces (2020) to 554 million pieces (2025)[113]
- Export Potential: ₹20,300 crores ($2.7B) export opportunity by 2025[113]
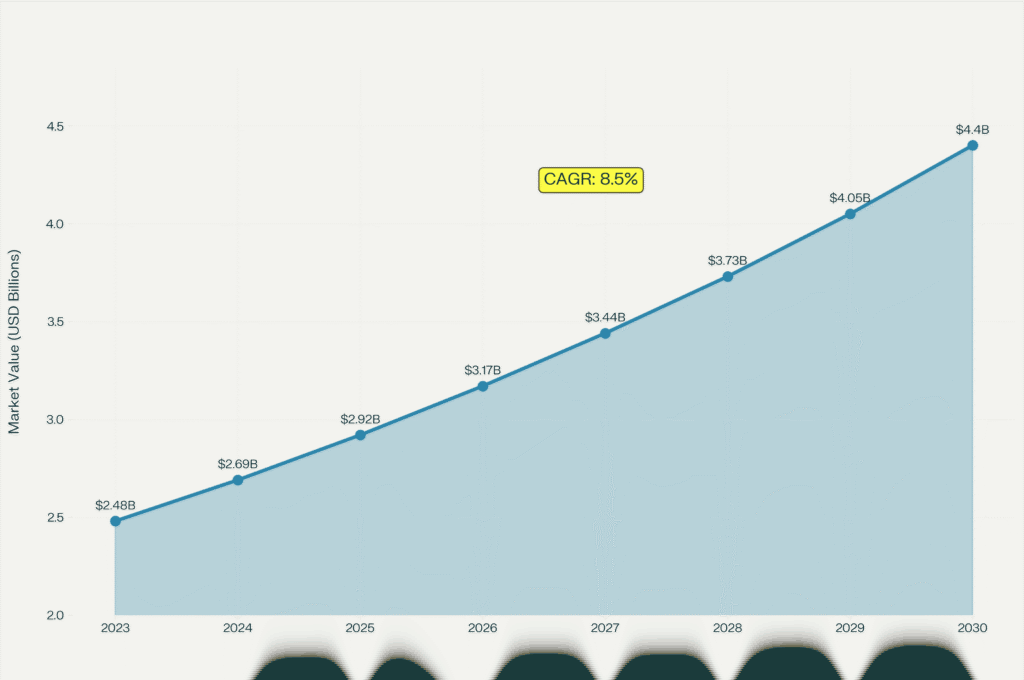
[183] – Growth visualization showing consistent market expansion trajectory
Fundamental Growth Drivers
Smartphone Adoption Acceleration
- User Base Growth: Expected to exceed 1 billion users by 2025[165]
- Rural Penetration: 56% of new internet users coming from rural areas[165]
- Female Participation: 65% of new internet users expected to be female by 2025[165]
- Tier-3 Growth: 19-20% YoY growth in tier-3 cities vs negative growth in tier-1[173]
Economic and Infrastructure Factors
- Disposable Income Growth: GNDI estimated at ₹200.86 lakh crore (2020-21)[164]
- Internet Penetration: 47% national penetration with rural areas leading growth[164]
- E-commerce Expansion: Online channel growing at 12-15% annually[164]
- 5G Rollout: Accelerating premium device adoption and accessory demand
Regulatory Standardization Impact
- BIS Certification: Mandatory IS 19348:2025 standard creating market formalization
- Quality Assurance: Fog marking/etching requirements eliminating fake products
- GST Revenue: Potential ₹18,500 crore cumulative GST gain (2021-2025)[113]
- Supply Chain Formalization: Compliance driving organized retail adoption
Regional Market Analysis and Growth Projections
West India: Market Leadership ($689M Market)
Market Characteristics:
- Market Share: 27.8% of national market[171][179]
- Market Size: $689 million (2025 estimated)
- Key States: Maharashtra, Gujarat, Goa
- Growth Drivers: High urbanization, industrial centers, tech adoption
Maharashtra – Flagship State
- Mumbai Metropolitan: 13 million internet users, highest in India[174]
- Internet Penetration: 70% statewide with urban centers exceeding 85%[174]
- Smartphone Adoption: Premium device preference, early technology adoption
- Market Characteristics: Price-conscious but quality-focused consumers
Gujarat – Manufacturing Hub
- Industrial Base: Strong manufacturing sector driving B2B demand
- Port Access: Kandla and JNPT facilitating import/export operations
- SME Density: High concentration of small and medium enterprises
- Growth Projection: 9-10% annual growth driven by industrial expansion
Strategy for West India:
- Focus on premium and mid-range tempered glass products
- Build strong distribution networks in industrial centers
- Emphasize BIS certification and quality compliance
- Target both B2C and B2B markets through industrial channels
North India: High-Growth Potential ($632M Market)
Market Characteristics:
- Market Share: 25.5% of national market (estimated)
- Market Size: $632 million (2025 projected)
- Key States: Delhi NCR, Punjab, Haryana, Uttar Pradesh, Rajasthan
- Growth Drivers: Government seat, high disposable income, tech-savvy youth
Delhi NCR – Premium Market
- Internet Penetration: 80% with 11.3 million users[167][174]
- Consumer Profile: High disposable income, brand conscious, early adopters
- Smartphone Preferences: iPhone and premium Android devices dominant
- Market Size: $180-200 million estimated market value
Uttar Pradesh – Volume Opportunity
- Population: 240+ million, largest state by population
- Internet Growth: 35% penetration with rapid rural expansion[167]
- Market Potential: Massive volume opportunity in tier-2/3 cities
- Price Sensitivity: Value-focused consumers seeking durable options
Punjab/Haryana – Agricultural Prosperity
- Rural Prosperity: High agricultural income driving smartphone adoption
- Brand Preference: Strong preference for trusted, durable brands
- Distribution: Traditional retail networks still dominant
- Growth Rate: 12-15% annual growth projected
Strategy for North India:
- Develop tier-2/3 city distribution networks
- Offer diverse price points from economy to premium
- Focus on durability and value proposition messaging
- Build partnerships with regional distributors and retailers
South India: Technology Hub ($575M Market)
Market Characteristics:
- Market Share: 23.2% of national market (estimated)
- Market Size: $575 million (2025 projected)
- Key States: Karnataka, Tamil Nadu, Kerala, Andhra Pradesh, Telangana
- Growth Drivers: IT industry, high education levels, tech awareness
Karnataka – Innovation Center
- Bangalore: 6.6 million internet users, India’s tech capital[174]
- Tech Industry: High concentration of IT professionals and startups
- Consumer Behavior: Premium product preference, feature-driven purchases
- Market Value: $140-160 million estimated
Tamil Nadu – Manufacturing Base
- Chennai: 6 million internet users, automotive and electronics hub[174]
- Industrial Demand: Strong B2B market for protective accessories
- Port Access: Chennai port facilitating import operations
- Growth Projection: 8-9% steady growth
Kerala – Highest Penetration
- Internet Penetration: 82%, highest in India[167][170]
- Literacy: Highest literacy rate driving tech adoption
- Consumer Awareness: High awareness of quality and certification
- Market Characteristics: Premium product preference, quality-focused
Strategy for South India:
- Target tech-savvy consumers with advanced features
- Emphasize technical specifications and certifications
- Build partnerships with electronics retailers and IT companies
- Focus on premium tempered glass and specialized products
East India: Emerging Growth ($392M Market)
Market Characteristics:
- Market Share: 15.8% of national market (estimated)
- Market Size: $392 million (2025 projected)
- Key States: West Bengal, Bihar, Jharkhand, Odisha
- Growth Drivers: Industrial development, improving connectivity, youth demographics
West Bengal – Cultural Hub
- Kolkata: 6.2 million internet users[174]
- Market Characteristics: Price-sensitive but brand-aware consumers
- Growth Rate: Steady 7-8% annual growth
- Distribution: Strong traditional retail presence
Bihar – Untapped Potential
- Rural Growth: 36% increase in internet population (2019)[174]
- Market Opportunity: Large population with improving connectivity
- Price Focus: Strong demand for economy and mid-range products
- Infrastructure: Improving retail and logistics infrastructure
Strategy for East India:
- Focus on value pricing and durable products
- Build strong rural distribution networks
- Emphasize brand trust and reliability
- Partner with local distributors familiar with regional preferences
Northeast India: Niche Opportunity ($191M Market)
Market Characteristics:
- Market Share: 7.7% of national market (estimated)
- Market Size: $191 million (2025 projected)
- Growth Rate: 20%+ annual growth in some states[167]
- Unique Factors: High growth from low base, improving connectivity
Strategy for Northeast India:
- Focus on emerging opportunities in key cities
- Build partnerships with local distributors
- Offer products suited to local preferences and climate
- Monitor rapid growth for scaling opportunities
[182] – Regional market size visualization showing West India’s leadership
State-wise Internet Penetration Impact on Market Potential
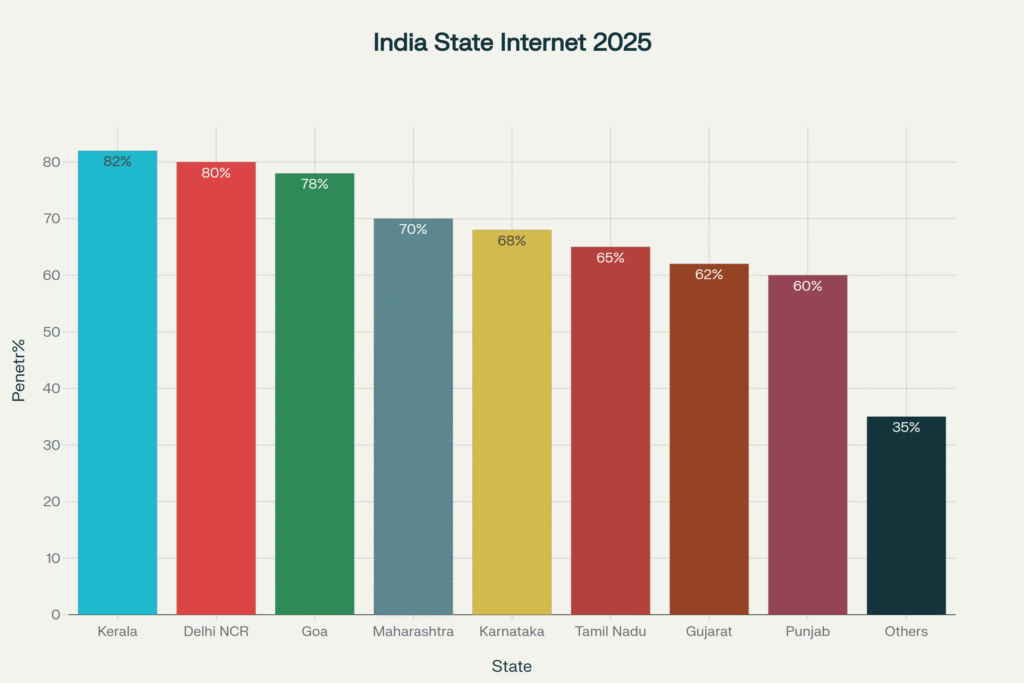
[184] – Internet penetration by major states influencing market accessibility
High-Penetration States (Immediate Opportunity)
Kerala (82% penetration): Premium market with high quality awareness
Delhi NCR (80% penetration): Affluent consumers, early technology adopters
Goa (78% penetration): Small but high-value market
Maharashtra (70% penetration): Large volume with diverse price segments
Medium-Penetration States (Growth Potential)
Karnataka (68% penetration): Tech industry driving premium demand
Tamil Nadu (65% penetration): Industrial and consumer market balance
Gujarat (62% penetration): Strong B2B and manufacturing demand
Punjab (60% penetration): Agricultural prosperity supporting purchases
Emerging States (Future Opportunity)
Uttar Pradesh (30% penetration): Massive potential as connectivity improves
Bihar (25% penetration): Large population with rapid growth trajectory
Rajasthan (55% penetration): Improving infrastructure and urban development
Tier-wise Market Analysis and Distribution Strategy
Tier-1 Cities (35% of Premium Market)
Characteristics:
- 8 Metro Cities: Mumbai, Delhi, Bangalore, Chennai, Hyderabad, Pune, Kolkata, Ahmedabad
- Market Focus: Premium and specialized products
- Growth Rate: Slower growth (2-3%) due to market saturation
- Consumer Profile: High disposable income, brand conscious, feature-driven
Distribution Strategy:
- Premium retail partnerships
- Brand stores and experience centers
- E-commerce platform focus
- Technical specification emphasis
Tier-2 Cities (27% of Market)
Characteristics:
- 98 Cities: Including Jaipur, Lucknow, Indore, Bhopal, Nagpur
- Market Focus: Balanced premium and value offerings
- Growth Rate: Moderate growth (6-8%) with steady demand
- Consumer Profile: Aspirational consumers, value-conscious
Distribution Strategy:
- Multi-brand electronics retailers
- Local distributor partnerships
- Competitive pricing strategies
- Brand building and awareness campaigns
Tier-3 Cities and Beyond (37% of Market, 19-20% Growth)
Characteristics:
- Rest of India: Small cities and towns
- Market Focus: Value products with durability emphasis
- Growth Rate: Highest growth (19-20% annually)
- Consumer Profile: Price-sensitive, upgrade-focused, durability-oriented
Distribution Strategy:
- Rural distribution networks
- Local retailer partnerships
- Affordable product lines
- Trust and reliability messaging
Technology Trends and Product Preferences
Product Category Performance
Tempered Glass Dominance:
- Market Share: 85-90% of total screen protector market[158]
- Growth Rate: Fastest growing segment at 8.5%+ CAGR
- Consumer Preference: Scratch resistance, optical clarity, durability
- Price Range: ₹150-800 retail (₹100-200 wholesale)[113]
Emerging Categories:
- Privacy Screens: 12% growth in metro cities
- Blue Light Filters: Health awareness driving 8% growth
- Anti-microbial Coatings: Post-pandemic hygiene focus
- Custom/Branded: Personalization trend in tier-1/2 cities
Price Segment Analysis
Premium Segment (₹300-800 retail):
- Markets: Tier-1 cities, South India tech centers
- Features: 9H hardness, oleophobic coating, brand partnerships
- Growth: 6-8% annually with margin focus
Mid-Range Segment (₹150-300 retail):
- Markets: Tier-2 cities, urban centers
- Features: Standard tempered glass, basic coatings
- Growth: 8-10% annually, volume driver
Economy Segment (₹50-150 retail):
- Markets: Tier-3 cities, rural areas, price-sensitive consumers
- Features: Basic protection, bulk packaging
- Growth: 12-15% annually in emerging markets
Seasonal Demand Patterns and Regional Variations
National Seasonal Trends
Q1 (January-March): Post-Festival Reset
- Demand Level: 85% of annual average
- Key Events: Budget announcements, school reopening, wedding season end
- Regional Variations: North India wedding season impact, South India harvest festivals
Q2 (April-June): Summer Preparation
- Demand Level: 95% of annual average
- Key Events: Exam seasons, summer vacation preparation
- Growth Areas: Tier-3 cities showing strongest growth
Q3 (July-September): Festival Season Build-up
- Demand Level: 115% of annual average
- Key Events: Back to school, upcoming festival preparation
- Regional Focus: East and West India festival shopping increases
Q4 (October-December): Peak Season
- Demand Level: 130% of annual average
- Key Events: Diwali, Christmas, New Year, bonus payments
- Market Impact: Premium product sales peak, rural market activation
Regional Festival Impact
North India Festivals:
- Karva Chauth/Diwali: 25-30% demand spike in October-November
- Holi: Spring device purchasing for gifting
- Wedding Seasons: Device gifting drives accessory sales
South India Celebrations:
- Onam (Kerala): August-September purchasing surge
- Pongal (Tamil Nadu): January harvest festival impact
- Ugadi (Andhra/Telangana): March-April new year celebrations
West India Events:
- Ganesh Chaturthi (Maharashtra): August-September peak
- Navratri (Gujarat): September-October festival shopping
- Gudi Padwa: March-April Marathi new year
East India Occasions:
- Durga Puja: Major September-October festival impact
- Kali Puja: October-November additional surge
- Poila Boishakh: Bengali new year in April
Competitive Landscape and Market Positioning
Market Structure Analysis
Organized vs. Unorganized Market:
- Organized Segment: 35-40% market share, growing due to BIS compliance
- Unorganized Segment: 60-65% market share, declining due to regulation
- Impact: BIS IS 19348:2025 accelerating formalization
- Opportunity: Quality-certified suppliers gaining market share
Brand Presence:
- International Brands: ZAGG, Belkin, Corning (premium segment)
- Indian Brands: Local manufacturers gaining compliance certification
- Chinese Brands: Price-competitive but facing regulatory challenges
- Unbranded: Declining share due to certification requirements
Distribution Channel Analysis
Online Channels (35% market share):
- Amazon India: Largest platform with extensive reach
- Flipkart: Strong in tier-2/3 cities
- Brand Websites: Direct-to-consumer growth
- Growth Rate: 15-18% annually
Offline Channels (65% market share):
- Multi-Brand Stores: Traditional electronics retailers
- Mobile Accessories Shops: Specialized local retailers
- Carrier Stores: Airtel, Jio, Vi retail partnerships
- Organized Retail: Croma, Reliance Digital expansion
SuperXTemperedGlass.com India Strategy and Positioning
Competitive Advantages for Indian Market
Comprehensive Compliance:
- BIS Certification: Full IS 19348:2025 compliance with fog marking
- Quality Assurance: <1% defect rates meeting Indian quality expectations
- Documentation: Complete certification and traceability systems
- Customs Support: Streamlined import procedures and anti-dumping compliance
Market-Specific Product Range:
- Regional Adaptation: Products tailored to Indian device preferences
- Price Segmentation: Economy to premium options for diverse markets
- Volume Capabilities: Scalable production for large Indian market demands
- Customization: Private label and bulk packaging solutions
Distribution Support:
- Pan-India Logistics: Efficient distribution to all regions
- Local Partnerships: Regional distributor and retailer networks
- Technical Support: Installation training and customer service
- Marketing Support: Co-branded campaigns and promotional materials
Strategic Recommendations for Indian Partners
Immediate Actions (0-6 Months):
- BIS Certification: Ensure all products meet IS 19348:2025 requirements
- Regional Assessment: Evaluate current distribution coverage by state
- Price Strategy: Develop competitive pricing for each market segment
- Compliance Training: Educate distribution partners on new regulations
Short-term Strategy (6-18 Months):
- Tier-2/3 Expansion: Build distribution networks in high-growth smaller cities
- E-commerce Growth: Strengthen online marketplace presence
- Product Localization: Adapt product mix to regional preferences
- Brand Building: Invest in awareness campaigns in target regions
Long-term Vision (18+ Months):
- Market Leadership: Establish dominant position in key regional markets
- Manufacturing: Consider local assembly to optimize costs and compliance
- Export Hub: Leverage India as regional export base for South Asia
- Innovation Center: Develop India-specific product innovations
Financial Projections and Investment Opportunities
Market Size Projections by Region (2025-2030)
West India Growth Trajectory:
- 2025: $689M → 2030: $1,040M (8.5% CAGR)
- Key drivers: Industrial growth, urbanization, premium adoption
North India Expansion:
- 2025: $632M → 2030: $955M (8.5% CAGR)
- Key drivers: Rural penetration, tier-3 city growth, youth demographics
South India Evolution:
- 2025: $575M → 2030: $869M (8.5% CAGR)
- Key drivers: Tech industry growth, premium product adoption
East India Development:
- 2025: $392M → 2030: $592M (8.5% CAGR)
- Key drivers: Infrastructure improvement, connectivity expansion
Northeast India Emergence:
- 2025: $191M → 2030: $289M (8.5% CAGR)
- Key drivers: Rapid digitalization, government initiatives
Investment Requirements and ROI Analysis
Distribution Network Investment:
- Tier-1 Cities: $50-100K per city for premium positioning
- Tier-2 Cities: $25-50K per city for market establishment
- Tier-3 Cities: $10-25K per city for volume building
- Total Investment: $2-5M for comprehensive national coverage
Expected Returns:
- Break-even Timeline: 12-18 months for established markets
- ROI Projections: 25-35% annually once established
- Market Share Target: 5-10% in key regional markets within 3 years
- Revenue Potential: $50-100M annual revenue at full scale
Risk Assessment and Mitigation Strategies
Market Risks
Regulatory Changes:
- Risk: Additional certification requirements or import restrictions
- Mitigation: Maintain compliance with highest standards, diversify sourcing
Economic Volatility:
- Risk: Economic downturns affecting consumer spending
- Mitigation: Diverse price segmentation, essential product positioning
Competition Intensification:
- Risk: Increased local manufacturing and competition
- Mitigation: Brand differentiation, quality leadership, innovation focus
Operational Risks
Supply Chain Disruptions:
- Risk: Import delays, customs issues, logistics challenges
- Mitigation: Multiple supply sources, local inventory, efficient customs processes
Currency Fluctuations:
- Risk: USD-INR exchange rate volatility affecting costs
- Mitigation: Natural hedging through local sales, currency hedging instruments
Distribution Challenges:
- Risk: Partner performance, market coverage gaps
- Mitigation: Multiple distribution channels, performance monitoring, direct sales capability
Conclusion and Action Plan
India’s mobile screen protector market offers exceptional growth opportunities with the market doubling from $2.48 billion to $4.40 billion by 2030. Regional analysis reveals distinct opportunities:
- West India leads in market size and premium positioning
- North India offers massive volume potential in tier-2/3 cities
- South India provides technology-focused premium opportunities
- East India presents emerging growth with value positioning
- Northeast India represents niche high-growth opportunities
Strategic Priorities:
- Immediate BIS Compliance: Ensure full IS 19348:2025 certification
- Regional Customization: Adapt strategies to local market characteristics
- Distribution Expansion: Build comprehensive pan-India networks
- Technology Investment: Leverage digital platforms and analytics
- Partnership Development: Establish strategic local partnerships
Success Metrics:
- Market Share: Achieve 5-10% regional market share within 3 years
- Revenue Growth: Build $50-100M annual revenue business
- Geographic Coverage: Establish presence in 100+ cities
- Customer Satisfaction: Maintain >90% customer satisfaction rates
- Compliance: 100% BIS certification compliance across all products
Partner with SuperXTemperedGlass.com to capitalize on India’s exceptional market opportunity. Our comprehensive product range, full BIS compliance, and strategic market insights provide the foundation for successful expansion across India’s diverse and rapidly growing mobile screen protector market.
Contact our India business development team to discuss customized market entry strategies, regional partnership opportunities, and comprehensive support for establishing market leadership in this high-growth market.
This analysis incorporates the most current market data available as of August 2025, including recent regulatory changes and market developments. Regional projections are based on current trends and may vary based on local economic and regulatory changes. For investment decisions, conduct additional local market validation and regulatory compliance verification.